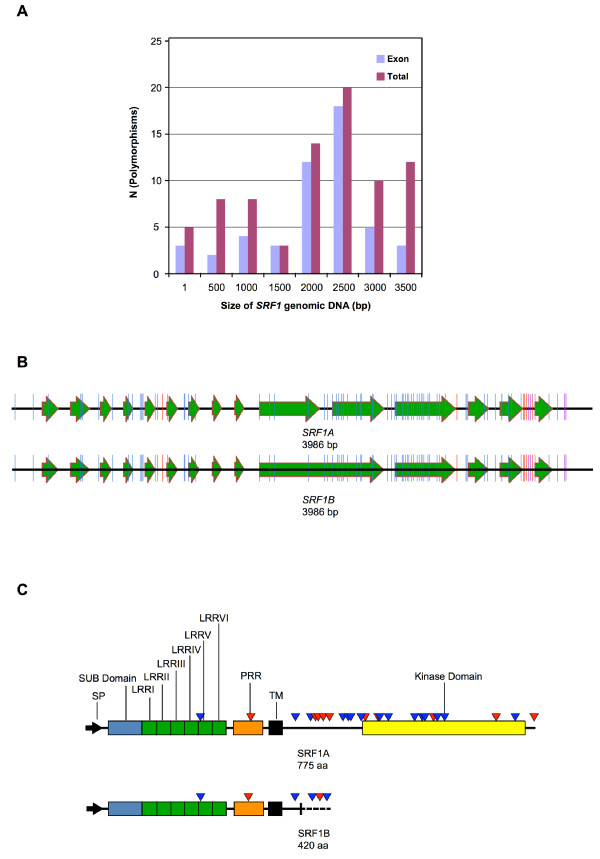
Figure 5.
The SRF1 Ler/Col polymorphisms. 5a) Frequency distribution of polymorphisms relative to the position within the SRF1 locus. 5b) Graphic representation of the location of the polymorphisms within SRF1. Large arrows indicate exons. Blue color denotes a single nucleotide polymorphism, red color marks an insertion and purple color highlights a deletion. 5c) Graphic representation of the location of the polymorphisms within the putative SRF1 proteins. The different C-terminus of SRF1B is marked by a vertical bar plus a dashed line. Polymorphisms are indicated by triangles. Red color highlights a non-conservative change, blue color a conservative or semi-conservative alteration.

