
Figure 4.
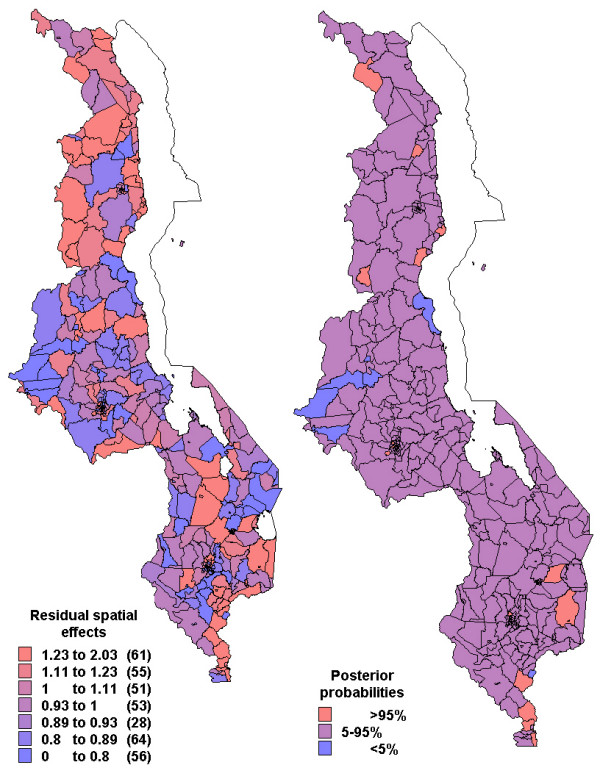
Residual spatial effects at sub-district level (3. health facility treatment versus no/traditional treatment). Shown are the relative risk ratio (RRR) on the left map. Right map shows corresponding posterior probabilities of RRR> 1: < 5 per cent blue, 5–95 per cent pink, >95 per cent red.