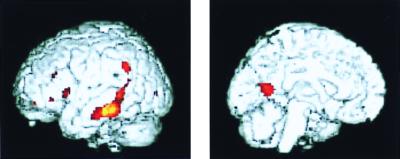
Figure 2.
Differences in cerebral metabolism in nondemented subjects according to genetic risk (SPM analysis). Lower metabolic levels are seen for the APOE-4 group (yellow and red areas) in left lateral temporal (P < 0.001), posterior cingulate (P < 0.001), and inferior parietal (P < 0.006) cortex. The region of peak significance (z = 3.24) lies in the temporal cortex in Brodmann's areas 20 and 21. Images are MRI structural images with superimposed SPM findings from PET.

