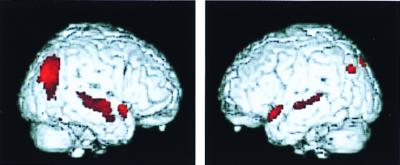
Figure 4.
Regions showing the greatest metabolic decline after 2 years of longitudinal follow-up in nondemented subjects with APOE-4 (SPM analysis) included the right lateral temporal and inferior parietal cortex (brain on the left side of figure). Voxels undergoing metabolic decline (P < 0.001, before correction) are displayed in color, with peak significance (z = 4.35) occurring in Brodmann's area 21 of the right middle temporal gyrus.

