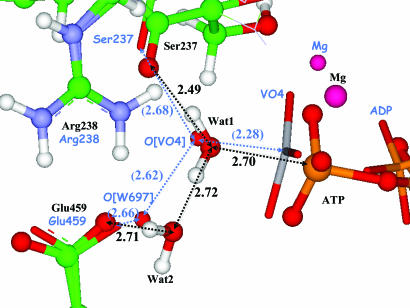
Fig. 2.
Superposition of the computed minimum-energy geometry configuration of the enzyme–substrate complex (ball-and-stick representation, labeling the species and distances in black) and the 1VOM crystal structure (sticks, labeling the species and distances in blue). The distances between heavy atoms are shown in angstroms. The values in parentheses refer to the 1VOM crystal structure (22).

