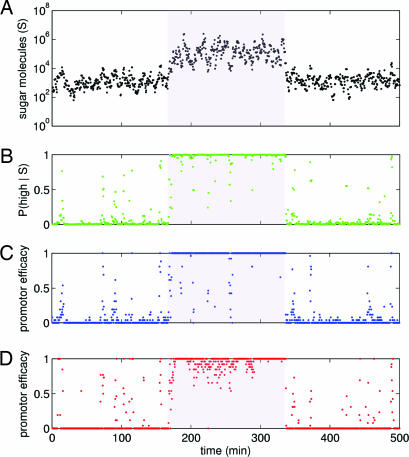
Fig. 3.
Two-state inference by simulated genetic networks. (A) A time series of intracellular sugar molecules as the extracellular environment moves from a low to a high (shaded region) and back to a low sugar state. Histograms of the intracellular sugar distributions are shown in Fig. 1C. Sugar was sampled every 25 s. In the low state, mean sugar numbers are ≈103; in the high state, mean sugar numbers are ≈105. (B) The instantaneous posterior probability of the high sugar state, P(high|S), for the particular sugar level existing at the current time point. Posterior probability points come from the green curve in Fig. 1C. (C) The average promoter efficacy for the best repressor network of Fig. 2, four sugar binding sites on the repressor and promoter type C. The actual promoter efficacy is either zero (promoter bound by repressor) or one (promoter not bound). An average over the 25-s period chosen to sample the sugar is shown. (D) The average promoter efficacy for the best activator network of Fig. 2, again four sugar binding sites on the activator and promoter type C. Simulation details are in SI Appendix.

