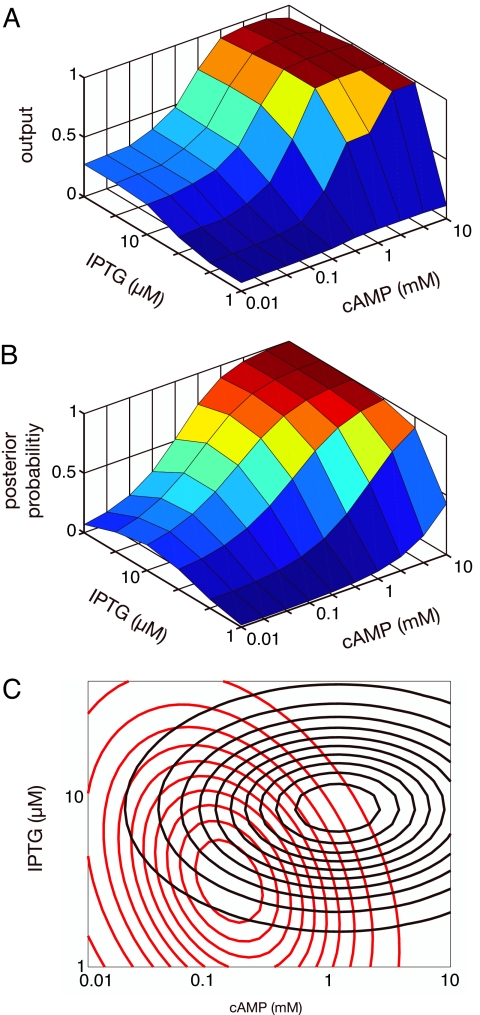
Fig. 4.
Inference by the lac operon in E. coli. (A) Observed transcriptional output (transcription rate) as a function of extracellular concentrations of IPTG and cAMP (both log-scaled), normalized to range from zero to one (data from ref. 11). (B) Posterior probability, fit to the data in A, that the environment is in a high state given the concentrations of IPTG and cAMP. (C) A possible two-state model for E. coli's view of its extracellular environment. The low state is in red (peak at approximately 3 μM IPTG and 0.2 mM cAMP), and the high state is in black (peak at 8 μM IPTG and 1.2 mM cAMP). Both states are described by bivariate lognormal distributions.

