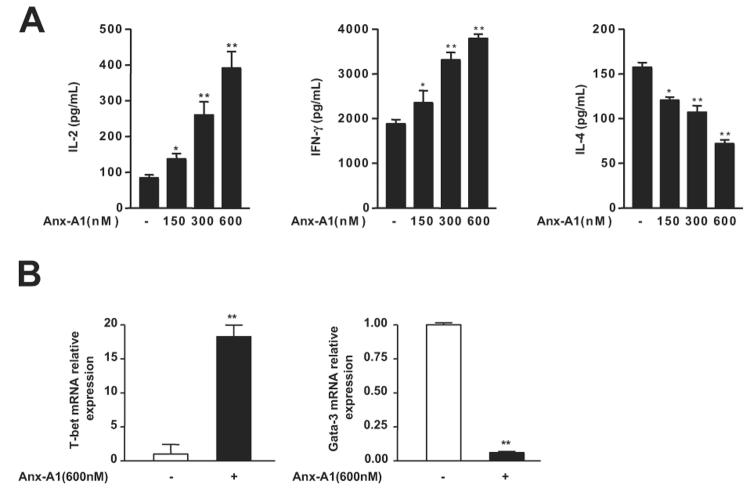
Figure 4.
Effect of Anx-A1 on differentiation of naive cells in effector cells in Th0 condition. (A) Th1/Th2 cytokine production profile of naive lymph nodes T cells differentiated in vitro in Th0 condition in the presence or absence of the indicated concentrations of hrAnx-A1 and then restimulated with plate-bound anti-CD3 (5.0 μg/mL) for 8 hours. Values are the mean ± SE of 4 to 5 mice. *P < .05; **P < .01. (B) Analysis of T-bet and GATA-3 expression by real-time PCR in cells differentiated in Th0 conditions in the presence or absence of the indicated concentration of hrAnx-A1 for 4 days. Values are the mean ± SE of 3 to 4 mice. **P < .01.

