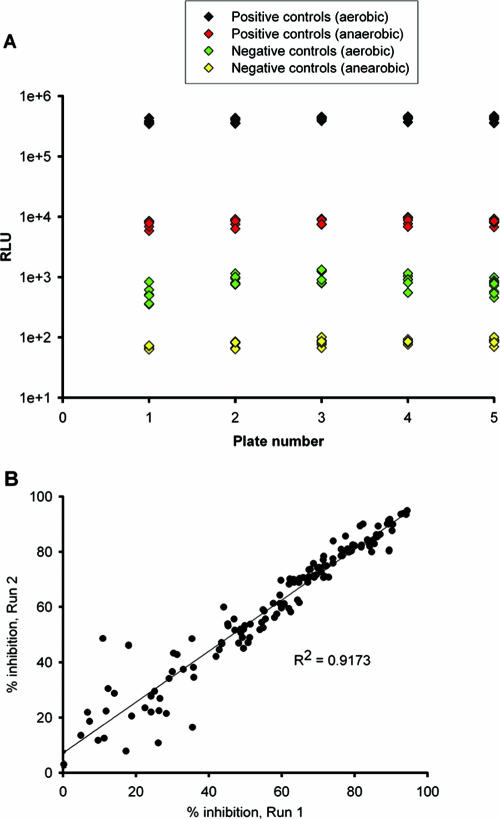
FIG. 4.
(A) Well-to-well variation for positive and negative control well signals from five plates of 31 antimicrobial agents. The calculated Z′ factor is in the range of 0.58 to 0.84. (B) Statistical analysis for reproducibility of duplicates. A significant linear correlation was observed between duplicate sets. Each of the 225 datum points represents the result of one independent experiment.

