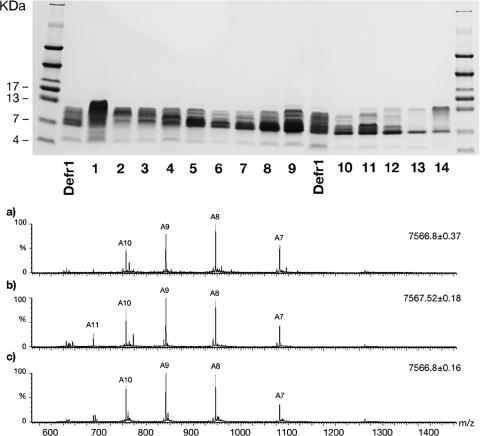
FIG. 1.
Analysis of fractions from reverse-phase HPLC separation of Defr1. Upper panel: native gel electrophoresis of Defr1 fractions in 16% Tricine gels. The 5-ml fractions taken from the HPLC preparation of Defr1 were subjected to electrophoresis in nondenaturing gels. Lower panel: electrospray ionization-mass-spectrum ion envelopes of fractions 2, 9, and 13 from the Defr1 HPLC. Spectrum a corresponds to fraction 2, spectrum b corresponds to fraction 9, and spectrum c corresponds to fraction 13. The mass of the dominant species (indicated above each x axis by an “A” followed by a numeral) is given for each spectrum; the mass values determined agree with the mass expected for the fully disulfide bridged form of the ion in each case, with an accuracy of ±1 Da. Peaks are labeled “An,” with the indicated numbers corresponding to the individual charge states given by the molecular ions of A in the form (M + nH)n+. Some small impurity peaks are noted. Similar spectra were obtained for all fractions despite their having somewhat dissimilar gel mobilities.

