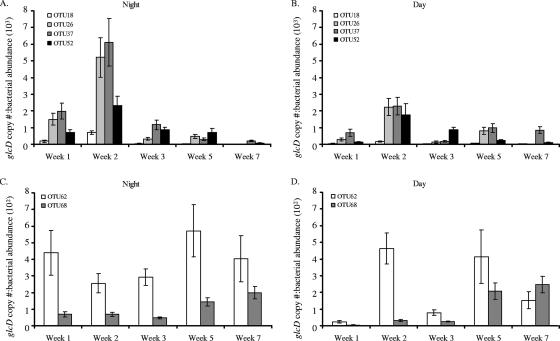
FIG. 3.
glcD copy number normalized to bacterial abundance (0.8- to 10-μm fraction) for one night and the following “noon” sample for each week of sampling. (A and B) Percentages of lower-abundance OTUs detected at night (A) and around noon (B) the next day. (C and D) Percentages of higher-abundance OTUs detected at night (C) and around noon (D) the next day. The OTU 68 values are the sums of the values for the two subgroups (OTU 68a and OTU 68b). The error bars indicate standard deviations for triplicate qPCR measurements of one sample per time. BD, below the limit of detection. Note that the y axis scales are different for different graphs.

