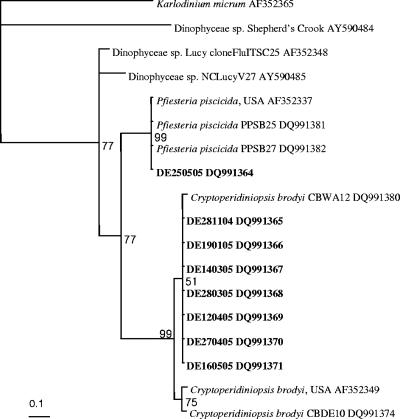
FIG. 4.
Phylogram based on Bayesian analysis of partial ITS2 rDNA sequences (128 bp) of environmental samples and closely related organisms. The environmental samples DE281104 to DE160505 were sampled from the Derwent River from 28 November 2004 to 16 May 2005. These samples were detected by C. brodyi-specific real-time PCR and were sequenced. The sample DE250505 was collected on 25 May 2005 and amplified with P. piscicida-specific real-time PCR. The numbers adjacent to each node represent probabilities which were derived from 150,000 generations using a general time-reversible evolution model with gamma-distributed (0.248) among-site rate variation. The strains sequenced in the present study are shown in bold. Consistency index, 0.837; rescaled consistency index, 0.696; retention index, 0.831; homoplasy index, 0.162.

