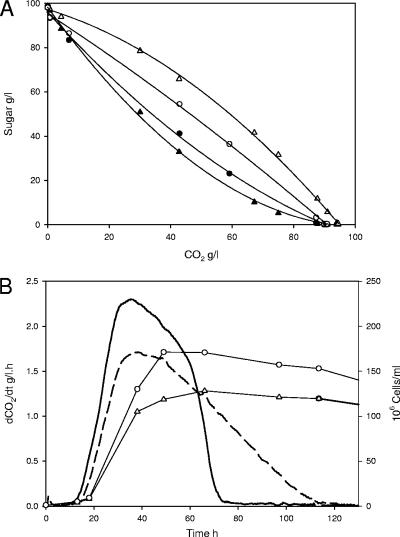
FIG. 4.
Sugar concentration profiles of engineered V5 hxt1-7Δ strains overexpressing the HXT3 gene from multicopy plasmid p4H7. (A) Changes in glucose (solid symbols) and fructose (open symbols) concentrations during fermentation of strain V5 hxt1-7Δ overexpressing HXT3 from V5 (triangles) or from Fermichamp (circles). (B) Fermentation kinetic profiles: fermentation rates of strain V5 hxt1-7Δ overexpressing HXT3 from V5 (dashed line) or Fermichamp (solid line) and cell number of strain with HXT3 from Fermichamp (circles) or from V5 (triangles).

