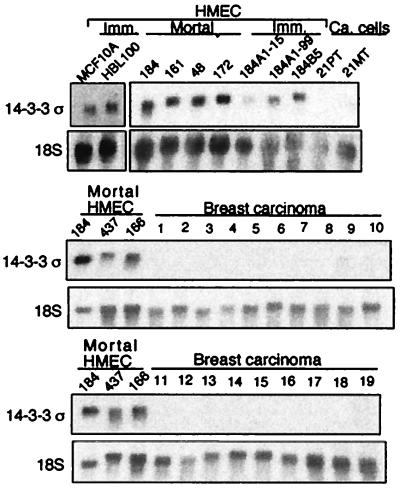
Figure 1.
Northern blot analysis of σ gene expression in HMECs and primary breast tumors. Data from 6 finite life span HMEC strains, 184, 161, 48, 172, 437, and 166 (Clonetics HMECs, 04372 and 16637); 5 immortal HMEC lines, 184B5, 184A1 (passage 15), 184A1 (passage 99), MCF-10A, and HBL-100; breast cancer cell lines 21PT and 21MT; 19 representative breast carcinomas are shown.

