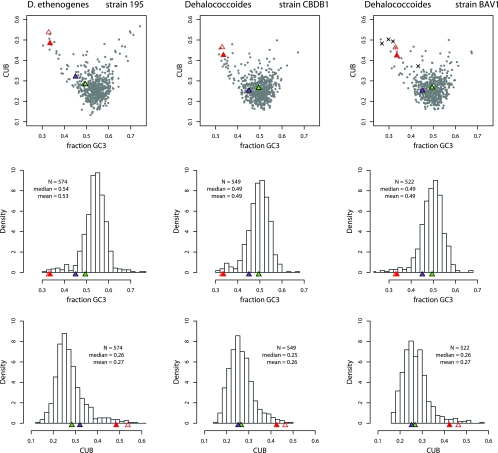
FIG. 2.
CUB of CE-RDase genes relative to the whole genome. (Top row) CUB of individual genes from the complete genomes of D. ethenogenes 195, CBDB1, and BAV1 plotted against GC3. The vcrA and bvcA genes are indicated by solid and open red triangles, while the tceA and pceA genes are indicated by green and purple triangles, respectively. ORFs from the genomes are indicated by gray circles. ORFs less than 300 codons long are not shown to mitigate the representation of sampling effects. ×, ORFs in the immediate vicinity of bvcA in the strain BAV1 genome. (Middle row) Histograms for GC3 of all genomic ORFs from the genome of each strain. N is the number of ORFs included in the plot. The relative positions of CE-RDase genes are indicated by colored triangles, as described above. (Bottom row) Histograms for CUB of all ORFs from the genome of each strain. Colored triangles indicate the locations of CE-RDase genes, as described above.

