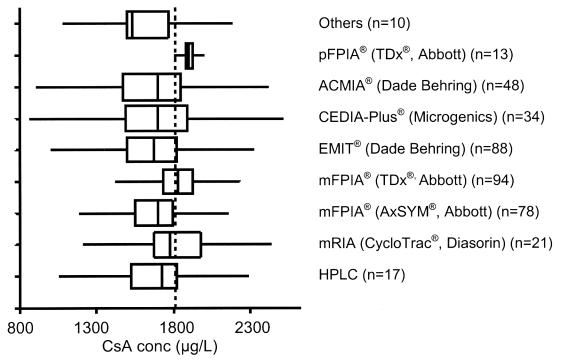
Figure 2.
Shows the results (as box-and-whisker plots) from one sample (225A) distributed in December 2002 from the International CsA Proficiency Testing Scheme where the CsA concentration exceeded the calibration range for most CsA immunoassay methods. The weighed-in concentration was 1800 μg/L (dashed vertical line). This illustrates the diversity of results returned from the 403 laboratories, regardless of assay method, and highlights the issues with performing accurate dilutions as recommended48 and discussed in the text. The line across the box represents the median, the lower and upper concentrations of the box represent the first and third quartile (25th and 75th percentile) respectively; and the lines extending beyond the box (the whiskers) represent the regions that are 1.5 times the interquartile range above and below the third and first quartiles.
This (unpublished) data is publicly available on the International CsA Proficiency Testing Scheme web-site (www.bioanalytics.co.uk).

