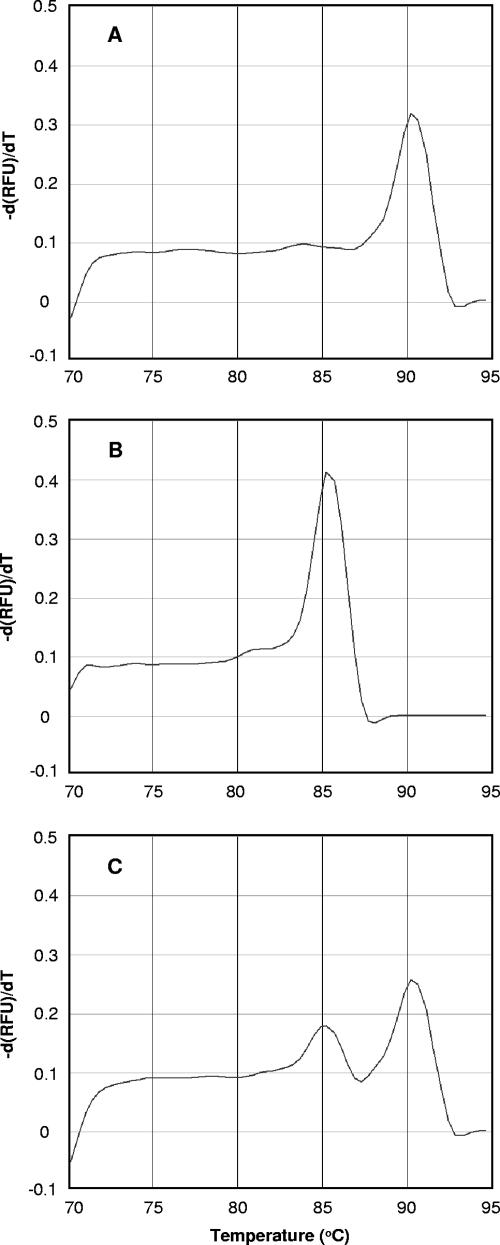
FIG. 2.
Melting curve profiles for the PCR amplicons amplified from bulk DNAs that were extracted from deep-sea hydrothermal fluid (A), surface seawater (B), and a mixture of equal amounts of bulk DNAs extracted from surface seawater and deep-sea hydrothermal fluid (C). The profiles are plots of the negative first derivatives of relative fluorescence units (RFU) [−d(RFU)/dT] versus temperature.

