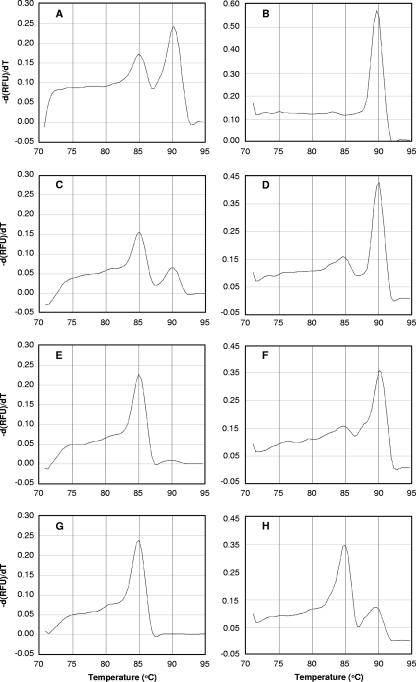
FIG. 4.
Melting curve profiles for the archaeal 16S rRNA genes amplified from bulk DNAs extracted from deep-sea hydrothermal fluid and surface seawater mixed at ratios of 1:1 (A), 1:10 (C), 1:100 (E), and 1:1,000 (G) and of second-PCR amplicons from archaeal 16S rRNA genes amplified from the 1:1 (B), 1:10 (D), 1:100 (F), and 1:1,000 (H) DNA mixtures after heat denaturation at 84°C and digestion with Exo I. The profiles are plots of the negative first derivatives of relative fluorescence units (RFU) [−d(RFU)/dT] versus temperature.

