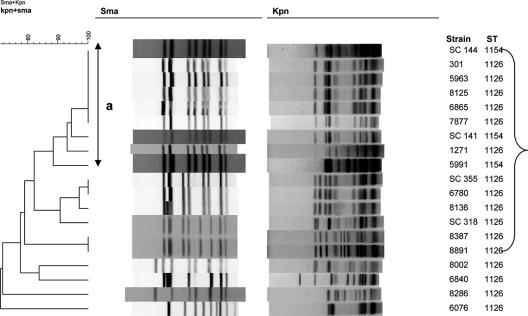
FIG. 2.
PFGE profiles of group I strains. Nineteen MDR strains were characterized by PFGE using SmaI and KpnI, and cluster analysis of the patterns was performed by BioNumerics as described in Materials and Methods. The line labeled “a” indicates strains with the same SmaI PFGE pattern (type a). The bracket indicates strains with closely related PFGE profiles.

