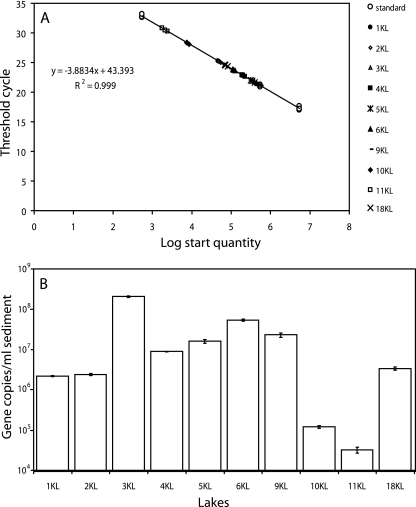
FIG. 3.
Abundance of the SRB in sediment samples by qPCR. (A) Standard curve for qPCR measurements of the dsr gene. The standard curve was calculated on the basis of a partially dsrB purified PCR product of known copy number. (B) SRB abundance (logarithmic scale) in the different soda lakes. Error bars represent standard deviations.

