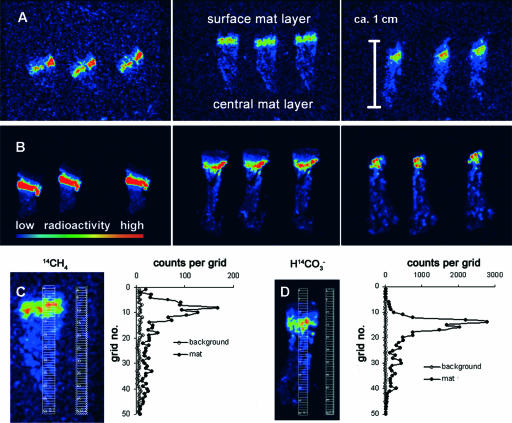
FIG. 2.
(A and B) Beta imager micrographs of three replicate mat pieces incubated with 14CH4 (A) or H14CO2− (B). Each micrograph shows the distribution of 14C in three consecutive mat sections. The mat sections are oriented vertically with the former mat-water interface at the top. A high level of 14C radioactivity (expressed in counts per hour) is indicated by red, and a low level of radioactivity is indicated by blue, as shown by the radioactivity bar. (C and D) Vertical profile of 14C distribution in a mat section incubated with 14CH4 (C) or H14CO2− (D). For determinations, a grid was placed on the section as well as on the background (no mat section) in the beta imager micrograph, and activity was expressed as counts per grid cell. The grid cell numbers are low at the former mat-water interface and increase toward the center of the mat.

