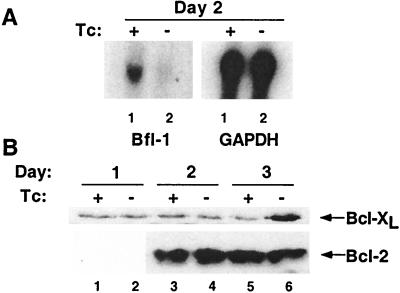
Figure 6.
NF-κB inhibition reduced A1/Bfl-1 expression, but not Bcl-x/L or Bcl-2 expression. (A) Western blot analysis of extracts for Bcl-x/L and Bcl-2. Lanes 1, 3, and 5 are extracts from cells grown in Tc+ media. lanes 2, 4, and 6 are from cells grown in Tc− media. Lanes 1 and 2, day 1; lanes 3 and 4, day 2; and lanes 5 and 6, day 3. (B) Northern blot analysis. Five micrograms of total RNA generated on day 2 was analyzed for Bfl-1 (Left) and glyceraldehyde-3-phosphate dehydrogenase, (Right). Lane 1, Tc+ media. Lane 2, Tc− media.

