FIG. 3.
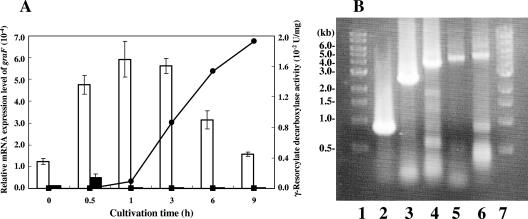
qRT-PCR and RT-PCR analyses. (A) Relative mRNA expression levels of graF and γ-resorcylate decarboxylase activity versus cultivation time. White bars show the relative mRNA expression levels of graF in total RNA prepared from Rhizobium sp. strain MTP-10005 cells cultivated in a minimal medium supplemented with 0.3% (wt/vol) γ-resorcylate. Black bars show the relative mRNA expression levels of graF in the total RNA prepared from Rhizobium sp. strain MTP-10005 cells cultivated in a minimal medium supplemented with 0.3% (wt/vol) glycerol. •, γ-resorcylate decarboxylase activity of cell extract prepared from Rhizobium sp. strain MTP-10005 cells cultivated in a minimal medium supplemented with 0.3% (wt/vol) γ-resorcylate; ▪, γ-resorcylate decarboxylase activity of cell extract prepared from Rhizobium sp. strain MTP-10005 cells cultivated in a minimal medium supplemented with 0.3% (wt/vol) glycerol. The temperature profile used for qRT-PCR was as follows: RT step (one cycle, 50°C, 30 min), initial PCR activation step (one cycle, 95°C, 15 min), PCR step (50 cycles, 94°C, 15 s; 55°C for 30 s; 72°C for 1 min), final annealing step (one cycle, 55°C, 30 s), and final denaturation step (one cycle, 95°C, 30 s). The sequence-specific standard curves were described with 1 ng, 10 pg, 100 fg, and 1 fg of pTGF or pTR16. (B) RT-PCR analysis of the graDAFCBE operon. Lanes 1 and 7, 1-kb DNA ladder; lane 2, internal 796 bp of graDA region; lane 3, internal 2,494 bp of graDAF region; lane 4, internal 3,780 bp of graDAFC region; lane 5, internal 4,616 bp of graDAFCB region; lane 6, internal 5,041 bp of graDAFCBE region. The temperature profile used for RT-PCR was as follows: RT step (one cycle, 45°C, 30 min), initial PCR activation step (one cycle, 95°C for 15 min), PCR step (forty cycles, 94°C, 10 s; 55°C, 30 s; 68°C, 5 min), and final extension step (one cycle, 68°C, 10 min).

