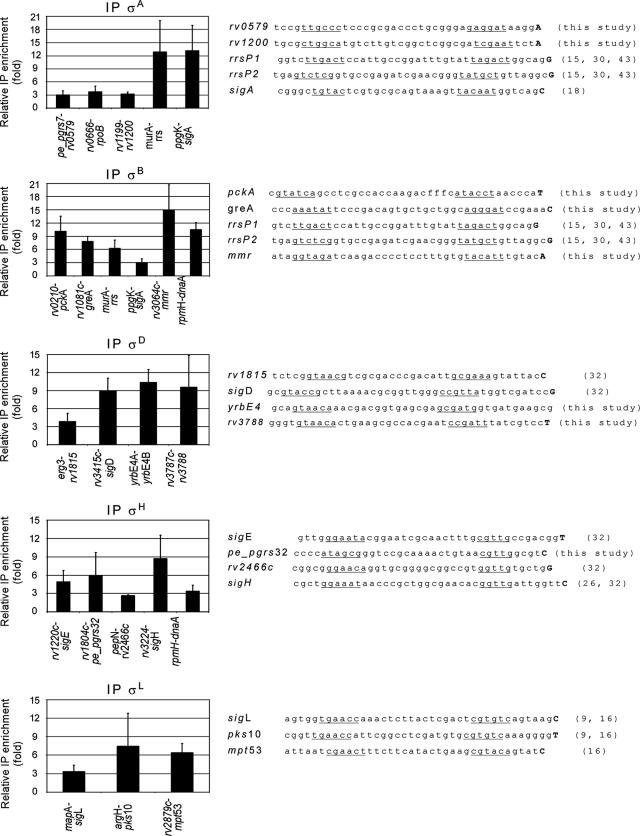
FIG. 5.
Additional σ factor binding sites identified by ChIP and promoters observed in the corresponding intergenic regions. The graphs on the left show the relative enrichment of specific σ factors for various intergenic regions, as monitored by the qPCR assay. The sequences on the right are promoter sequences found in intergenic regions where binding of the corresponding σ factors was detected. Proposed promoter boxes are underlined, and the first transcribed nucleotide is indicated by a boldface uppercase letter where it is known. The numbers in parentheses are references.

