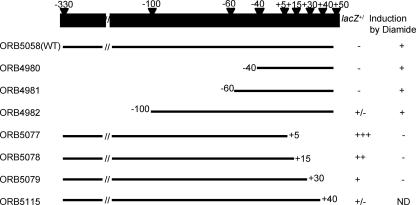
FIG. 4.
Summary of deletion analysis of the spx P3 promoter region. The top bar shows the intact spx promoter and the positions of deletion endpoints relative to the transcription start site. All constructs generated by PCR were fused with the promoterless bgaB gene as the reporter. The bgaB expression levels from the respective fusions after integration into the chromosome were examined by screening on DSM agar plates containing 40 μg/ml X-gal (blue [+], white [−], and pale blue [+/−]). Transcriptional induction was determined by the extraction of RNA from diamide-treated and untreated cells bearing spx-bgaB fusions followed by primer extension analysis. + indicates that transcriptional induction after diamide treatment was detected. − indicates that a loss of induction was detected after diamide treatment. ND, no data.

