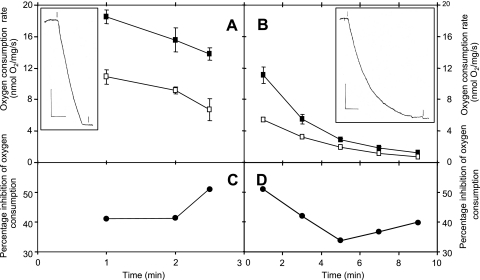
FIG. 3.
Respiration of C. jejuni and effects of cyanide on wild-type and cydAB whole cells. Respiration rates are plotted as a function of time after the addition of formate to resting cell suspensions for both wild-type (A) and cydAB mutant (B) cells. The insets show typical oxygen electrode traces over the period leading to oxygen depletion in the chamber. In the insets, the vertical bars represent 20% air saturation (approximately 40 μM O2), and the horizontal bars represent 2 min. At the first marker, formate was added, and at the second, sodium dithionite was added. In main panels A and B, respiration rates were plotted for the absence (closed symbols) and presence (open symbols) of 100 μM cyanide, which was added 5 min before formate. The percentage of inhibition by cyanide is shown for wild-type (C) and cydAB mutant (D) cells.

