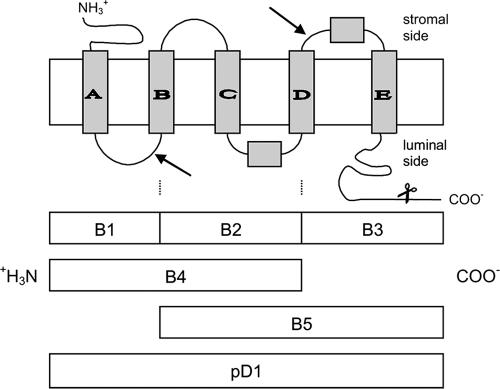
FIG. 1.
D1 protein structure in the thylakoid membrane. Gray boxes A to E represent the five transmembrane helices. The arrows indicate the protease cleavage sites. The recombinant proteins, representing the naturally occurring degradation products, are displayed below. The scissors show the point of C-terminal processing during maturation.

