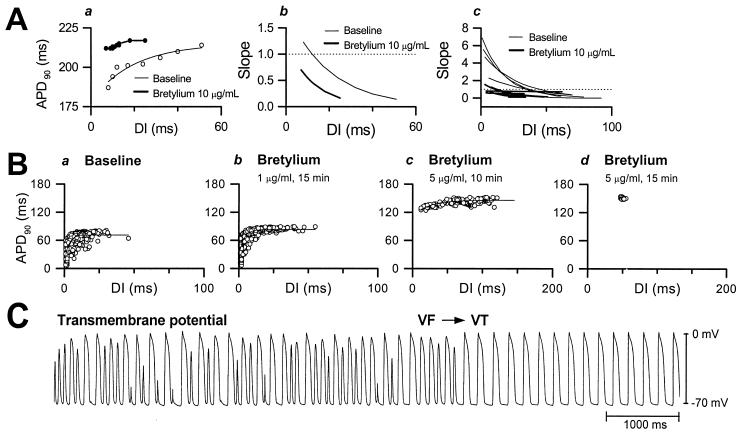
Figure 1.
(A) Effects of bretylium on APDR (a) and its slope (b), measured by the standard S1-S2 method. The effects on APDR slope in all six hearts is shown in c (thin lines are control, thick lines are bretylium). (B) The effects of increasing bretylium dose on APDR during VF. (C) Transmembrane potential recording during the bretylium-induced transition from VF to VT.

