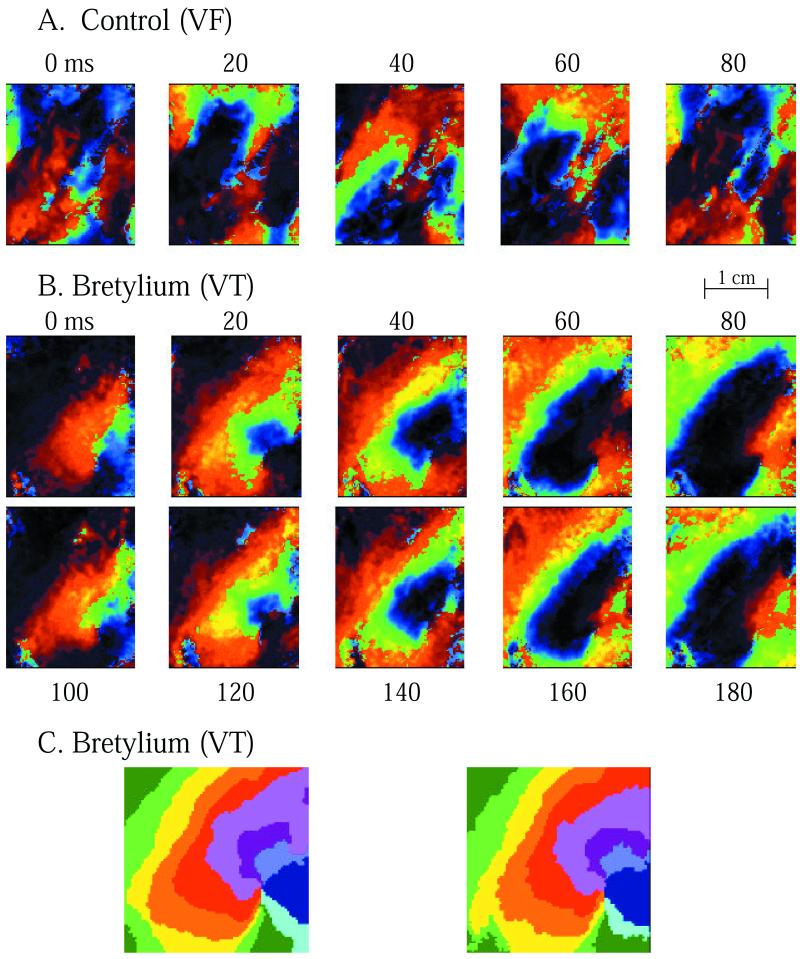
Figure 2.
Effect of bretylium on spiral wave activity. Optical snapshots of voltage before and after the administration of 10 μM bretylium. Voltage is shown here color-coded, from red (highest voltage) to blue (lowest). (A) Under control (drug-free) conditions, VF was characterized by multiple irregular wave fronts. These give rise to the irregular segment of the transmembrane potential recording in Fig. 1C. (B) After bretylium administration, a pair of counter-rotating spiral waves remains in the tissue and gives rise to the periodic transmembrane potential activity in Fig. 1C. The mapped region shown contains the lower of the two counter-rotating spirals. Shown here are 10 snapshots, taken at evenly spaced 20-ms intervals. Note that two complete successive rotations of a stable spiral wave can be seen. [These were two successive rotations of a nearly identical sequence of about 15 rotations that could be observed (data not shown).] (C) Twenty successive 10-ms isochrones from the two rotations of the spiral wave shown in B. (Left) First rotation. (Right) Second rotation. Movies of the VF and VT episodes are published as supplemental data on the PNAS web site, www.pnas.org.

