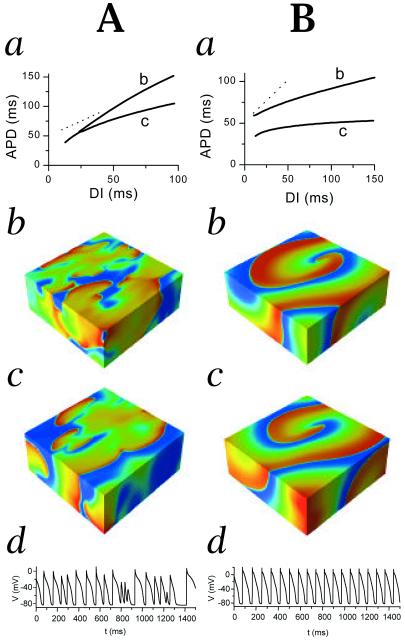
Figure 4.
Computer simulation of effects of APD restitution on scroll wave stability. (Aa) APDR curves (APD vs. DI) for the Luo-Rudy I ventricular action potential model for two different values of Ḡsi (the maximal value of the slow inward Ca2+ current). Prolonging APD by increasing Ḡsi increased the slope of the APDR curve. The dashed lines in Aa and Ba have slope = 1. (A b and c) Snapshots of voltage [coded from red, denoting depolarized tissue (highest voltage) to blue for resting tissue (lowest voltage)], 1 sec after initiation of a single scroll wave in a three-dimensional slab of cardiac tissue. The initial scroll wave has spontaneously broken up into a fibrillation-like state for both conditions. (Ad) Transmembrane potential from one cell in simulation Ab. (Ba) Flattened APDR curves after modification of the Luo-Rudy action potential model (see Methods), for two different mean values of APD. (B b and c) Snapshots of voltage 2 sec after initiation of a single scroll wave, corresponding to the two restitution curves above. In each case, the scroll wave remained intact and did not break up into a fibrillation-like state. (Bd) Corresponding transmembrane potential from simulation Bb.

