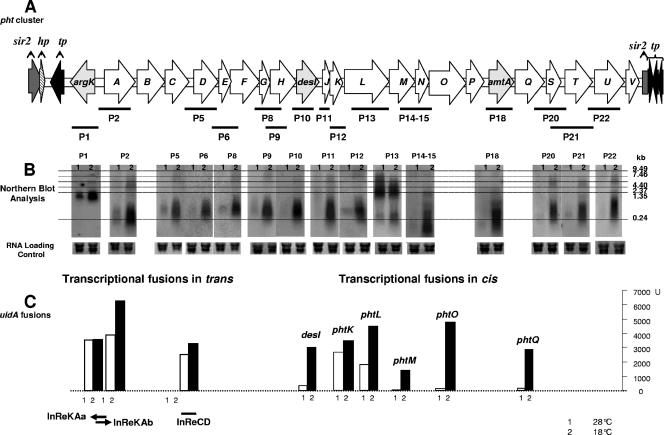
FIG. 1.
Pht cluster of P. syringae pv. phaseolicola NPS3121 and expression patterns. (A) Graphic representation of the Pht cluster. Each arrow represents each gene, with the direction of the arrow indicating the direction of transcription. The probes (P1, P2, etc.) used for the Northern blot analysis are graphically represented by the bars under the genes. (B) Northern blot results with each of the corresponding probes. Assessment of transcription activity as β-glucuronidase activity or mRNA-DNA hybridization. (C) Transcriptional fusions in trans: β-glucuronidase activity from the InRe cloned into the promoter trap vector pRG960sd. The cloned regions are represented graphically under the corresponding value bars. Transcriptional fusions in cis shows β-glucuronidase activity from pht::uidA constructs. The fused genes are indicated above the corresponding value bars. The small numbers under the bars or on top of the Northern blots represent the temperatures at which expression was assayed: 1 indicates 28°C and 2 indicates 18°C.

