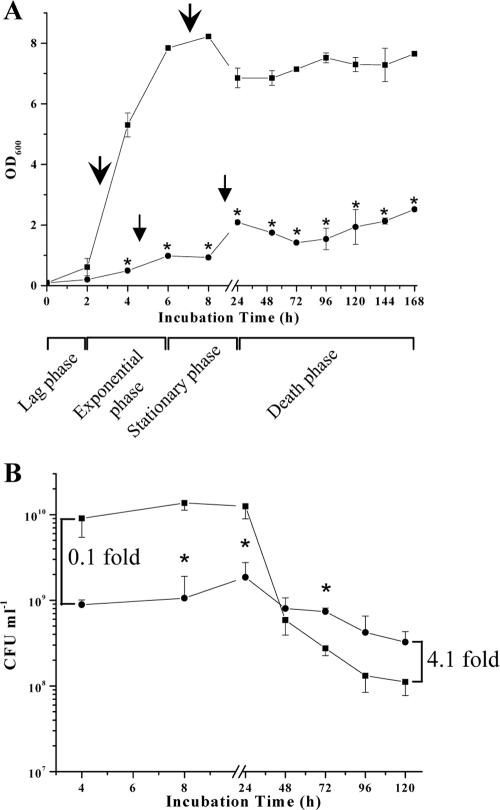
FIG. 1.
(A) Long-term growth analysis of normal (non-TD) S. aureus and TD-SCV. Growth curves (optical density at 600 nm [OD600]) of normal S. aureus (▪) and TD-SCV (•) were determined in BHI medium under aerobic conditions. Arrows indicate the time points for total RNA extraction. The data shown are means ± standard errors of the means (error bars) for values obtained from three independent experiments. Values that are significantly different from the values for normal S. aureus (P < 0.001 by t test) are indicated (*). (B) Thymidine limitation in TD-SCV S. aureus enhances post-stationary-phase survival. Cultural aliquots were removed at different time intervals of normal S. aureus (▪) and TD-SCV (•) from the growth analysis cultures, plated on BHI agar plates, and incubated at 37°C for 24 h to 48 h. The values (CFU per milliliter) were determined in triplicate. The data shown are means ± standard deviations (error bars) for values obtained from two independent experiments. The indicated increases (0.1-fold and 4.1-fold increases) relate CFU counts of the TD-SCV with those of normal S. aureus at respective time points (4 h and 120 h) and refer to differences in viability of the TD-SCV versus normal S. aureus (please refer also to the calculated “survival advantage” in “Thymidine auxotrophism impairs exponential-phase growth but enhances stationary-phase survival in the TD-SCV.”). The comparison of the two curves as a whole shows that the curves are significantly different referring to the population as well as the incubation time (two-factor analysis of variance, P ≤ 0.001), with significant differences at select time points (*, P ≤ 0.05 compared to normal S. aureus [t test]).

