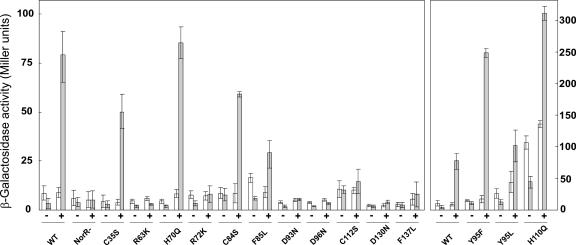
FIG. 2.
Transcriptional activation of the norA promoter by NorR and mutated derivatives of NorR. Promoter activation by NorR was induced by the addition of 2 mM SNP (+) and compared to uninduced cells (−). Activities (expressed in Miller units) were determined at 4 h (white bars) and 20 h (gray bars) after induction. The wild type (WT) and NorR mutants are indicated at the bottom. Standard deviations (error bars) were estimated from three to six independent experiments. The panel at the right is presented at a different scale to fit mutants with high activities.

