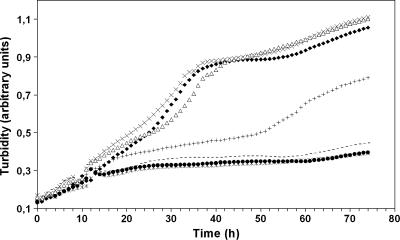
FIG. 3.
Growth of mutant strains by denitrification as shown in a microtiter plate assay. Each curve represents the mean of four to six individual cultures. Turbidity was measured at 436 nm. Δ, wild type; •, NorR-negative mutant; +, NorR-F85L; *, NorR-D96N; ⧫, NorR-Y95F; ×, NorR-H110Q; -, NorR-C112S. The inflection point of the curves around 12 h reflects a lag phase of cell growth during adaptation from aerobic growth to denitrification, which was due to residual oxygen in the culture wells.

