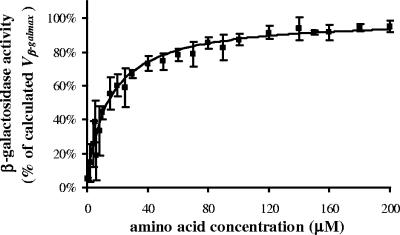
FIG. 1.
β-Galactosidase activity affected by amino acid concentration. The final curve was the result of 20 different experiments conducted in an 8-month period to reduce effects due to climatic influence. The experimental points (▪) are expressed as mean percentages of β-galactosidase activity versus amino acid concentrations ± standard errors (SE) (error bars) of 3 to 20 tests. At first, the absolute value of β-galAA=0 was calculated in every test and subtracted from the experimental points, in order to evaluate β-galactosidase activity only due to added amino acids. The upper limit of the β-galactosidase/cell production Vmax was then determined in every test by nonlinear least-squares analysis (Microcal Origin version 5.0 software) in the following hyperbole equation: y = (Vmax × x)/(Km + x). After that, the following equation was calculated: Vβ-galmax = Vmax + β-galAA=0. In order to recalculate, in every test, β-galAA=0 and all experimental points as percentages of Vβ-galmax, we assumed the limiting value Vβ-galmax to be the highest hypothetical β-galactosidase activity per cell (100%) inducible at the test conditions. Finally, by introducing the mean β-galAA=0 as a constant value in the hyperbole equation y = β-galAA=0 + [(Vmax × x)/(Km + x)], we generated a final curve which was calculated from the means of normalized experimental points.

