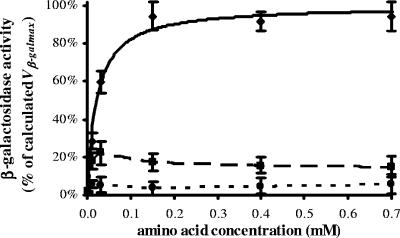
FIG. 2.
β-Galactosidase activity of E. coli K-12 affected by amino acid concentration. See Materials and Methods for the procedure. The AA curve (for all 20 amino acids; solid line) was determined as described in the legend to Fig. 1. Microcal Origin version 5.0 software was used to plot the effects of AA-leucine (dashed line) and AA-isoleucine (dotted line) by interpolation. The experimental points (⧫, ▪, and •) are expressed as mean percentages ± SE (error bars) of three to six tests.

