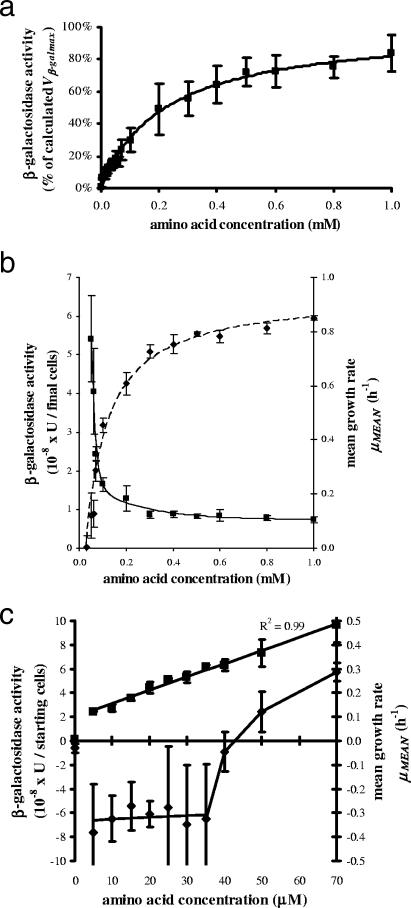
FIG. 4.
(a) β-Galactosidase activity affected by amino acid concentration. Overnight cultures in LB (0.5 ml) were centrifuged and diluted to 50 to 300 cells per ml in 0.1 mM IPTG in PB, and then aliquots of 2.25 ml were incubated at 37°C in the presence of growing concentrations of amino acids. After 270 min, β-galactosidase activity was measured as described in Materials and Methods. The experimental points (▪) are expressed as mean percentages ± SD (error bars) of five to seven tests. The curve was determined as described in the legend to Fig. 1. (b) β-Galactosidase activity and mean growth rate affected by amino acid concentration. See the description for Fig. 4a for the procedure. β-Galactosidase activity (▪) was expressed as enzymatic units per the final number of cells. Cell counts were performed as described in Materials and Methods. β-Galactosidase activity versus amino acid concentration was fitted as an exponential decay of the third order via Microcal Origin version 5.0 software. Mean growth rate (μmean; ⧫) versus amino acid concentration was determined by nonlinear least-squares analysis via Microcal Origin version 5.0 software with the following hyperbole equation: y = μAA=0 + [(μmax × x)/(Km + x)]. Since the hyperbolic relationship was valid only for μ values of >0, μAA=0 is a fictitious value which was calculated only for regression purposes. For μmean values of ≤0, see Fig. 4c. The experimental points (▪ and ⧫) are expressed as means ± SE (error bars) of five to seven tests. (c) β-Galactosidase activity and mean growth rate affected by amino acid concentration. See the description for Fig. 4a for the procedure. The curve representing β-galactosidase activity (▪) was determined by linear least-squares analysis. μmean (⧫) was calculated as described for Fig. 4b. The experimental points (▪ and ⧫) are expressed as means ± SE (error bars) of five to seven tests.

