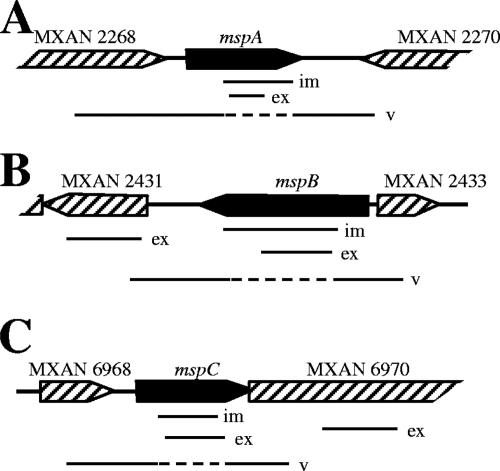
FIG. 3.
Genomic organization of msp genes: schematic diagrams for mspA (A), mspB (B), and mspC (C) (solid bars). Surrounding ORFs (striped bars) in the M. xanthus chromosome are also included. The relative positions are indicated for PCR products used to generate insertional mutations (im), to measure gene expression by RT-PCR (ex), and to verify insertion of the Kanr plasmid into the site of the gene (v). The dashed lines for the verification PCR products indicate potential sites into which the Kanr plasmid has integrated.

