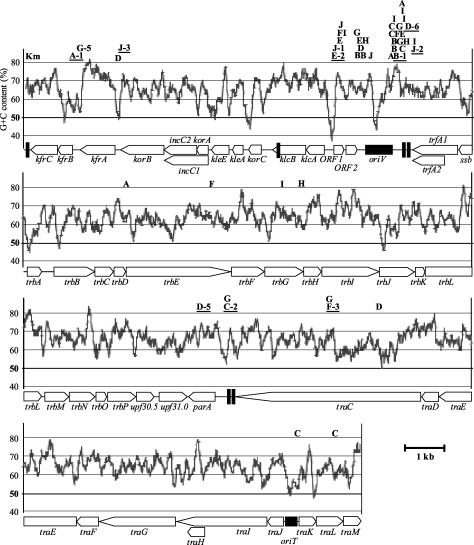
FIG. 1.
Physical map and G+C content of pBP136, showing the insertion sites of Tn21Km. The letters A to J indicate insertion sites in plasmids obtained from 10 independent mating experiments. Plasmids with insertions at the sites shown by underlined letters were used to investigate the plasmid stability and cost. Km indicates the location of the Kmr gene in pBP136Km. The black vertical bars represent the positions of the 20-bp IRs. The G+C content of pBP136 was calculated in an average calculation span of 100 bp. See reference 26 for detailed information on the genetic structure and function of the plasmid.

