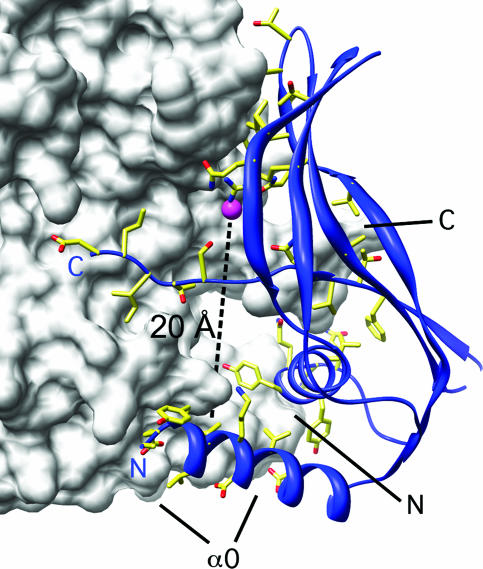
FIG. 3.
Putative ligand binding site at the YycI dimeric interface. One subunit is shown as a white surface representation, and domain 3 of the other is shown as a blue ribbon. Side chains lining the dimerization interface are shown. The ion bound at the end of the putative ligand-binding cavity (positioned along the dashed line) is shown as a magenta sphere. N and C termini and α0 are labeled for reference in both subunits.

