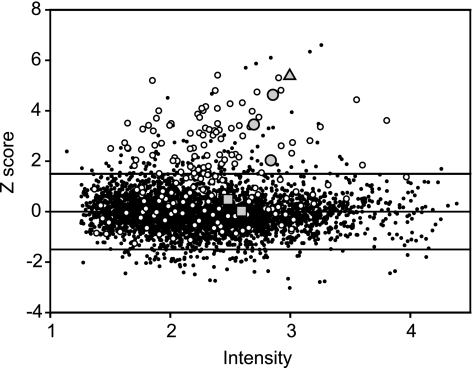
FIG. 2.
Nitrosative stress-regulated transcription in B. subtilis. Changes in gene expression levels as determined by microarray analysis of mRNA levels in exponentially aerobically growing 1A1 (wild-type) cells treated with 0.5 mM SNP for 5 min are shown. The signal intensity represents the base 10 logarithm of the square root of the product of Cy3 and Cy5. The intensity-dependent Z score measures the number of standard deviations by which a particular data point differs from the local mean. The horizontal lines mark the Z-score threshold value (1.5 or −1.5) that is considered significant. Data points above or below these lines represent genes that are significantly up- or down-regulated, respectively, in SNP-treated cells. Open circles, transcripts reported to depend on σB; gray circles outlined in black, nasDEF; triangle, hmp; squares, yjbIH. For the transcriptome data set, see supplemental data 1 in the supplemental material.

