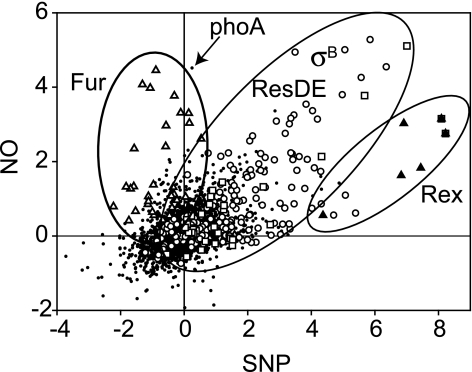
FIG. 8.
Graphical comparison of the SNP and NO stimulons of B. subtilis. The fold changes (log2) of gene expression levels of the two data sets are plotted. The data for the NO stimulon are those reported for B. subtilis cells treated with 50 μM NO for 5 min (21). The data for the SNP stimulon were obtained in this work (Fig. 2). Members of the Fur (open triangles), σB (open circles), ResDE (open squares), and Rex (closed triangles) regulons are highlighted. The signal corresponding to the phoA transcript is indicated with an arrow.

