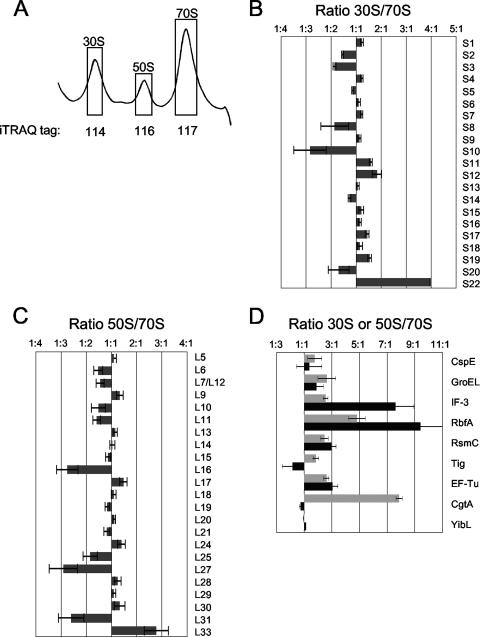
FIG. 3.
iTRAQ analysis of ribosomal particles isolated from E. coli MG1655 cells grown at 16°C. (A) Representative ribosomal profile trace of E. coli MG1655 grown at 16°C. Fractions representing 30S, 50S, and 70S ribosomal particles (shown in boxes) were pooled and labeled with isobaric tags 114, 116, and 117, respectively. Tag 115 was left blank. (B and C) Ratios of small ribosomal proteins (30S/70S) (B) and large ribosomal proteins (50S/70S) (C) are shown. (D) The ratios (30S/70S [black] or 50S/70S [dark gray]) of certain proteins are given. Error bars show standard errors of the means.

