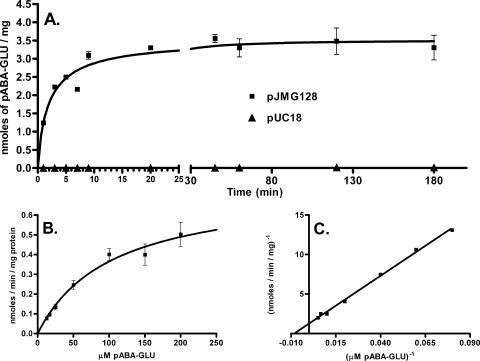
FIG. 3.
Transport of radioactive p-aminobenzoyl-glutamate. (A) Time course of p-aminobenzoyl-glutamate uptake by MG1655 cells transformed with pJMG128 (a pUC18-derived plasmid expressing AbgT) and the parent vector pUC18. Assays were performed as described in Materials and Methods. Briefly, cells were grown overnight, washed, and resuspended in minimal medium. After preincubation, the transport assay (final volume, 6 ml) was initiated by the addition of [3H]p-aminobenzoyl-glutamate to a final concentration of 50 μM. Duplicate samples (0.1 ml) were taken at the times shown following initiation. Samples were filtered, immediately washed with ice-cold minimal medium, and counted. Data were analyzed with GraphPad Prism 4; error bars represent standard errors. (B) Effect of p-aminobenzoyl-glutamate concentration on the initial uptake of [3H]p-aminobenzoyl-glutamate by MG1655 transformed with pJMG128. Assays were performed as described in Materials and Methods. After preincubation, the transport assay (final volume, 6 ml) was initiated by the addition of [3H]p-aminobenzoyl-glutamate; final concentrations used were 12.5 μM, 16.7 μM, 25 μM, 50 μM, 100 μM, 150 μM, and 200 μM. For each concentration, a reaction was initiated and duplicate samples (0.4 ml) were taken within the first few minutes following initiation. Samples were filtered, immediately washed with ice-cold minimal medium, and counted. For each concentration, linear regression analysis was performed, and the slope of the line was measured and taken as the initial velocity. Data were analyzed with GraphPad Prism 4; error bars represent standard errors. (C) Lineweaver-Burk plot of the data from panel B.

