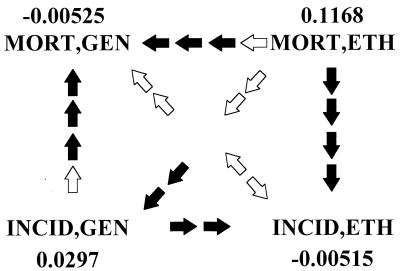
Figure 1.
Comparison of second-order partial correlations for mortality and incidence. The variables are distances or differences coded: MORT, mortality; INCID, incidence; ETH, ethnohistory; and GEN, genetics. Values shown are averages over all cancers, both sexes, and regions of Europe, where applicable. Arrows point from higher to lower values. The number of solid arrows indicates the number of Wilcoxon signed-ranks tests adjudged significant at an experimentwise error rate ≤ 2.17%. Hollow arrows show the direction of a nonsignificant inequality. Of the four tests performed for the nonsignificant MORT,GEN-INCID,ETH contrast, three indicate INCID,ETH > MORT,GEN, and one indicates INCID,ETH < MORT,GEN.

