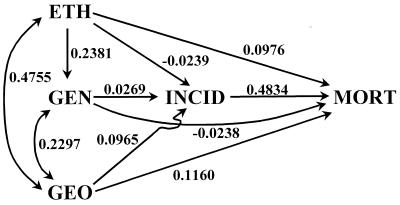
Figure 2.
Path diagram for zero-order partial correlation coefficients (ordinary pairwise correlations) between distances or differences of the indicated variables. Double-headed arrows indicate correlations; single-headed arrows are paths from the base to the tip of the arrows. The numerical values alongside the arrows indicate magnitudes of the correlations or path coefficients.

