
Figure 7.
Effects of expression of EGFP-Rab3A and EGFP-Rab27A on regulated secretion. In PC12 cells. Cells were transfected with the vectors indicated, as well as 0.5μg pXGH5 human growth hormone (hGH)-encoding vector, and pEGFP-C1 so that each transfection mix contained 1μg of DNA. After 48 hours, cells were washed and hGH release over 15 minutes was assayed. Cellular hGH and secreted hGH were assayed, and secreted hGH was expressed as a percentage of the total (n=6 for each condition).
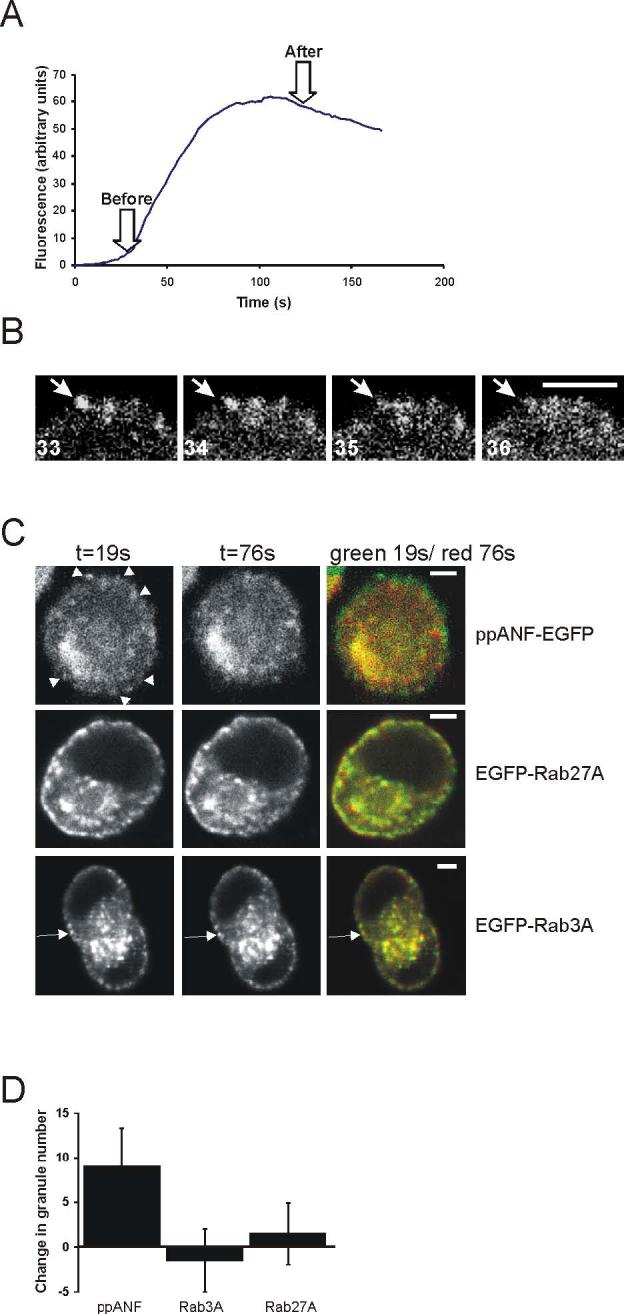
Figure 7. Effect of activation of exocytosis on secretory granules labelled with EGFP-ppANF, EGFP-Rab3A or EGFP-Rab27A in live cells. Cells were transfected to express EGFP-ppANF, EGFP-Rab3A or EGFP-Rab27A and imaged 18h after transfection. Cells showing low levels of fusion protein expression were selected for observation and stimulated by perfusion with 300μM ATP. A. Example of the time course of calcium changes from monitoring of X-Rhod fluorescence following ATP stimulation (n=11 cells). B. Disappearance of a ppANP-EGFP-labelled granule during stimulation. The images shown are sequential frames in which the sudden disappearance of a granule (arrow) can be observed. C. Effect of stimulation with 300μM ATP on secretory granules labelled with EGFP-ppANF, EGFP-Rab3A or EGFP-Rab27A as indicated. Images were taken of cells at 19s of the recording and also at 76s (after the elevation in cytosolic calcium). Overlay images are shown with t=19s in green and t=76s in red so that granules that disappear between the images are seen in green. Granules that disappeared in the ppANF-EGFP cell are indicated by arrowhead. Some granules did not disappear but moved during the recording and so appear green in the overlay and an example is indicated by the arrow in the EGFP-Rab3A transacted cell. The numbers of granules that disappear between the before and after images were identified by the comparison of images at 19 and 76s, quantified and shown as mean ± SEM for 8 cells expressing each construct. The scale bars represent 4 μm.