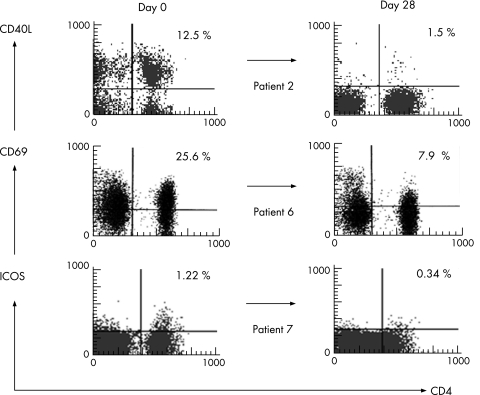
Figure 3 Changes in expression of functional molecules on CD4‐positive cells induced by rituximab treatment. The expression of CD40L (patient 2), CD69 (patient 6) and ICOS (patient 7) on CD4‐positive cells was measured before (day 0) and 28 days after rituximab treatment. Percentages represent the percentage of CD4‐positive cells expressing the functional molecules.

An official website of the United States government
Here's how you know
Official websites use .gov
A
.gov website belongs to an official
government organization in the United States.
Secure .gov websites use HTTPS
A lock (
) or https:// means you've safely
connected to the .gov website. Share sensitive
information only on official, secure websites.
