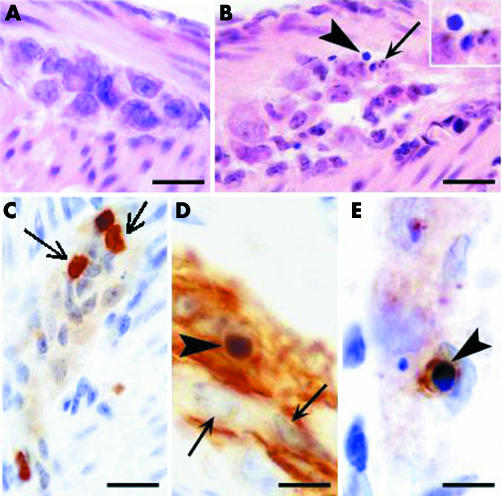
Figure 2 Histological analysis of the myenteric plexus of control and transgenic mice. (A) Haematoxylin‐eosin stained section shows a myenteric ganglion in control mice. No injury or no inflammatory infiltrates can be seen (bar 20 μm). (B) Haematoxylin‐eosin stained section from a transgenic animal shows a damaged myenteric ganglion. Arrowhead points at an apoptotic cell with condensed nucleus (magnified in inset). The arrow indicates the presence of parts of an apoptotic cell, the so‐called apoptotic bodies (bar 20 μm). (C) Staining for CD3 revealing inflammatory T lymphocytes in the myenteric plexus from a transgenic mice (arrow; bar 20 μm). (D) Staining for glial fibrillary acidic protein (GFAP) shows enteric glial cells in a myenteric ganglion. The arrowhead indicates a GFAP+ cell with a small and homogenously dark stained condensed nucleus indicative of apoptosis. Arrows indicate normal nuclei which are larger and show heterochromatin patches (bar 10 μm). (E) Staining for active caspase‐3 showing an apoptotic cell (probably a glial cell) in a myenteric plexus. Again, note condensation of the nucleus (arrowhead; bar 10 μm).

An official website of the United States government
Here's how you know
Official websites use .gov
A
.gov website belongs to an official
government organization in the United States.
Secure .gov websites use HTTPS
A lock (
) or https:// means you've safely
connected to the .gov website. Share sensitive
information only on official, secure websites.
