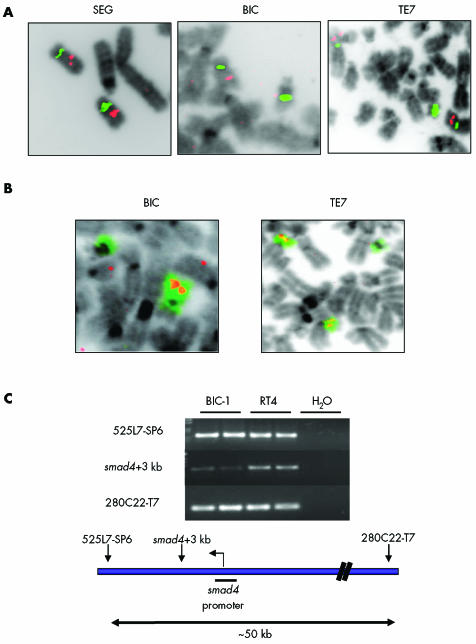
Figure 6 Chromosome 18 and smad4 analysis in cell lines. (A) Fluorescence in situ hybridisation images using probes for the centromere (green) and smad4 (red) in SEG‐1, BIC‐1, and TE7. (B) Structural rearrangements involving chromosome 18 identified using whole chromosome 18 paint (green) and SMAD4 (red) in BIC‐1 and TE7. SEG‐1 cells have two copies of chromosome 18 and two copies of Smad4. Chromosome 18 rearrangements in TE7 are balanced and no loss of smad4 has occurred. BIC‐1 cells contain only one copy of chromosome 18 and subsequently only one copy of smad4. (C) Polymerase chain reaction analysis of BIC‐1 and control RT4 DNA showing that the remaining allele of smad4 in BIC‐1 is affected by a deletion spanning a 30–50 kb region of chromosome 18, including the smad4 promoter.

An official website of the United States government
Here's how you know
Official websites use .gov
A
.gov website belongs to an official
government organization in the United States.
Secure .gov websites use HTTPS
A lock (
) or https:// means you've safely
connected to the .gov website. Share sensitive
information only on official, secure websites.
